 Despite the presence and constant introduction of new tools for storing and managing data, Microsoft Excel is undoubtedly the most basic and widely used tool across businesses. It is versatile, simple to use, and includes a range of functions that make it ideal for most users.
However, there is a downside to everything, and the simplicity of Excel makes it difficult to work with complex data sets. This is where Power BI services come into play, which can help you visualize, analyze, and share Excel files online.
The best part: Microsoft Power BI and Microsoft Excel are both powerful tools that can be integrated to create even more powerful data analysis and visualization capabilities.
Microsoft Power BI is a valuable business intelligence tool that enables users to connect different data sources, design interactive visualizations, and share them. Meanwhile, Microsoft Excel is a spreadsheet program that is popularly used for data analysis and organization.
By integrating Microsoft Power BI Services with Excel, users can take advantage of the strengths of both tools to create powerful, interactive dashboards and reports that can be easily shared and accessed by team members.
Know More About Our Microsoft 365 and Consulting Services
Importing Excel Data and Creating Reports in Power BI
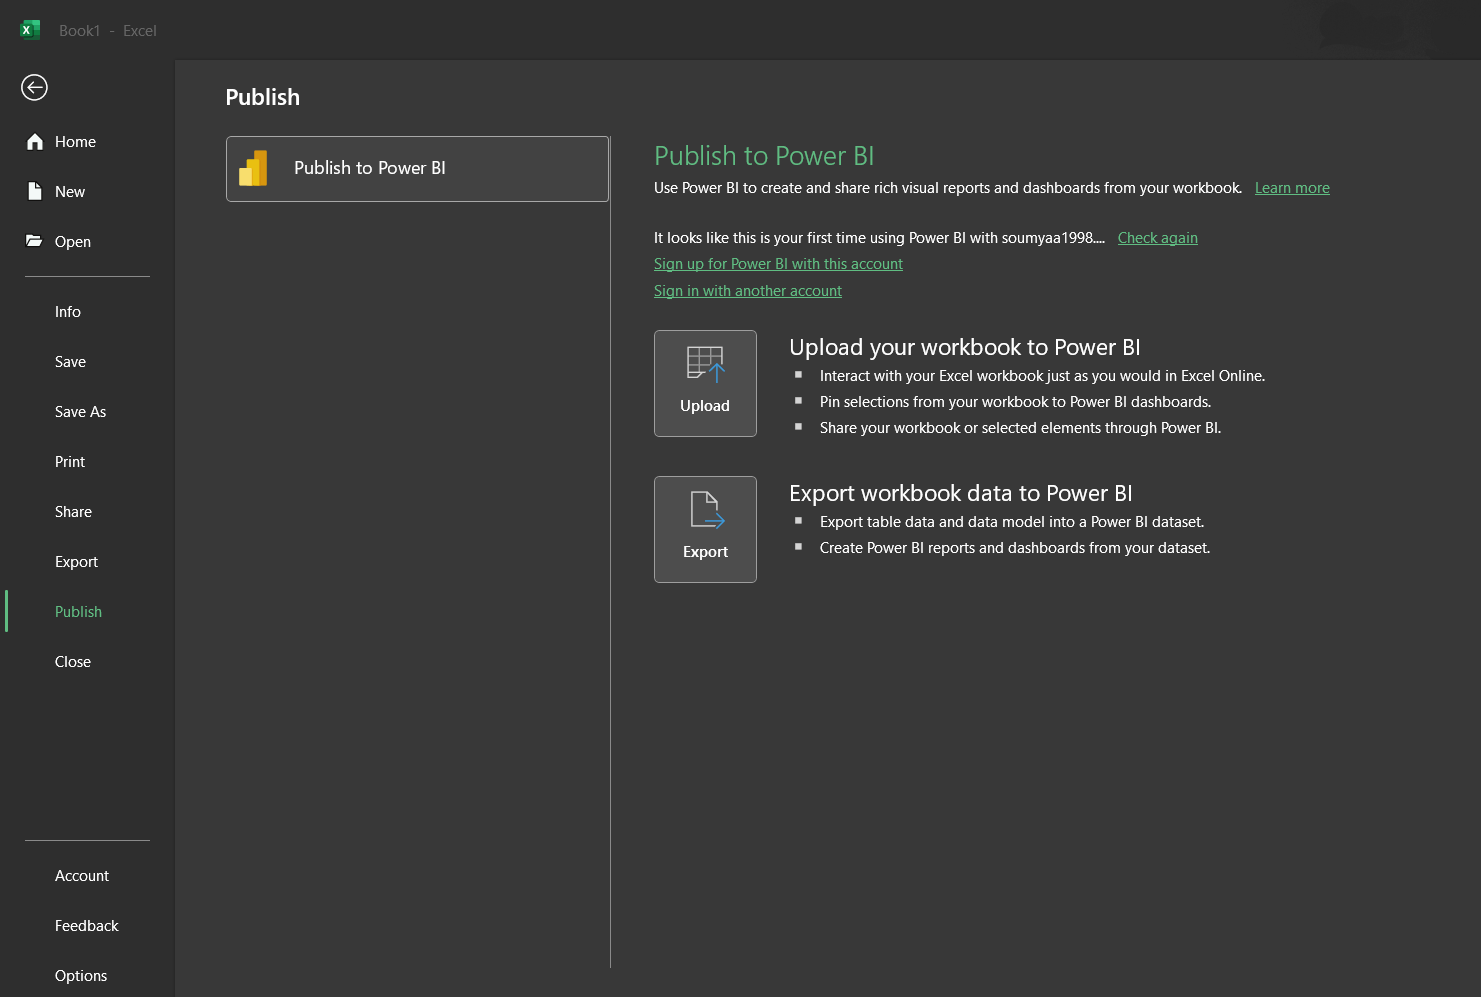
- In order to view Excel files in the Power BI dashboard, Power BI needs to publish the file onto Power BI. For this, go to Excel and open the file that needs to be published in Power BI. Sign in using your Microsoft account for this.
 (Screenshot from Excel)
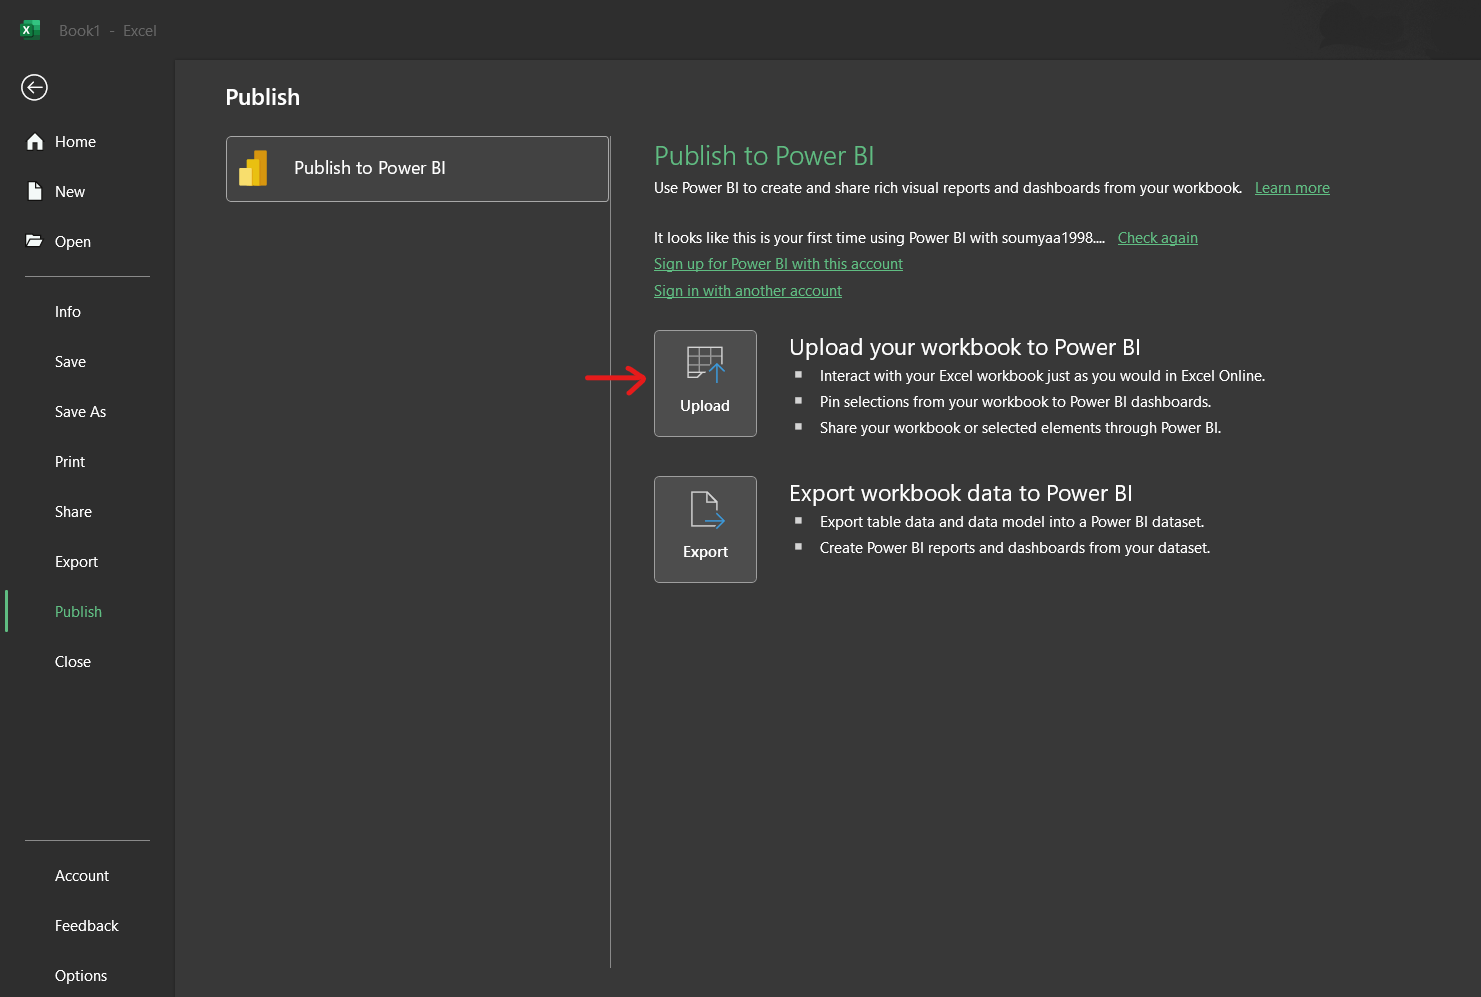
- Once you have signed in, go to ‘Publish to Power BI,’ and you can choose ‘Upload your workbook to Power BI.’
 (Screenshot from Excel)
- Now, you will get the notification ‘PUBLISH TO POWER BI Workbook uploaded successfully.’
- After you get this message, go to Power BI, ‘My Workspace.’ In the Workbooks tab, you can see the Excel file that you published.
- Click on this file and view the Excel file as-is.
- To create a report, go to the “Report” view in Power BI Desktop and select the “Fields” pane. Drag and drop the fields required in your report onto the canvas.
- To create visualizations, go to the “Visualizations” pane and select the type of visualization you need, such as a bar chart, pie chart, or map. Drag and drop the fields required in the visualization onto the appropriate fields in the visualization.
- Use the formatting options in Power BI Desktop to customize the look of the report. You can change the font, color, and overall appearance of the report to match your needs.
- You can then publish it to the Power BI Service, which is a cloud-based platform that allows you to share reports with others. To publish the report, click “Publish” in the Home ribbon.
And you are done! You can similarly import Excel data and create reports in Power BI while sharing a cloud-based report with your team to help you visualize and analyze your data in more powerful ways.
Creating Interactive Dashboards in Excel Using Power BI
Similar to creating interactive reports in Power BI, you can also import your Power BI reports into Excel to be shared. Here are the steps to create interactive dashboards in Excel using Power BI:
- Start by opening Power BI Desktop, go to “Export” in the Home ribbon, and select “Analyze in Excel.” Alternatively, you can browse to the location of your Excel file, select the file and click “Load.”
- After connecting to the Excel file, Power BI will show a preview of the data. You can adjust the data type, column names, and any other changes before loading the data.
- Once you have made any necessary changes, click “Load” to import the data into Power BI.
- To create a report, go to the “Report” view in Power BI Desktop and select the “Fields” pane. Drag and drop the fields required in your report onto the canvas.
- To create visualizations, go to the “Visualizations” pane and select the type of visualization you need, such as a bar chart, pie chart, or map. Drag and drop the fields needed in the visualization onto the appropriate fields.
- Use the formatting options in Power BI Desktop to customize the report’s look and feel. You can change the font, color, and overall appearance of the report to match your needs.
- To publish the report onto the Power BI Service, click “Publish” in the Home ribbon. The report will be saved to the cloud, where others can access it.
- To embed the report, open the Excel file where the report is to be added. Go to “Insert” in the ribbon and select “Power BI Embedded.” Select the report, and it will be embedded in the Excel file as an interactive dashboard.
Tips for Best Practices and Troubleshooting Common Issues
To use Power BI and Excel efficiently, here are some tips and best practices to help you avoid common issues:
- Plan your dashboard: Before creating the dashboard, take some time to plan and decide what data should be displayed and how it should be presented. This will help ensure that your dashboard is effective and efficient.
- Keep the dashboard simple: It’s tempting to add as many visualizations and features as possible to the dashboard, but it’s best to keep it simple and focused. Stick to the most important metrics and avoid clutter, which can make the dashboard difficult to use.
- Use the right data: Ensure that the data you are using is accurate, up-to-date, and relevant to the dashboard. Incorrect or irrelevant data will compromise the effectiveness of the dashboard.
- Format the dashboard for readability: Use clear and consistent formatting to make the dashboard easy to read and understand. Use color, font, and other design elements to highlight important information and provide context.
- Test the dashboard: Before sharing the dashboard, test it thoroughly to ensure it works as expected. Check that all the visualizations are correct and that the data is displayed accurately.
- Update the data regularly: To keep the dashboard accurate and relevant, update the data regularly. This will ensure that the dashboard remains a useful tool for data analysis and decision-making.
- Data refresh errors: If the data in the dashboard is not updating as expected, check the data source connection and ensure it’s set up correctly. Also, check the data refresh schedule to ensure that it’s set to update at the desired frequency.
- Slow performance: If the dashboard is slow to load or respond, try reducing the number of visualizations and data sources and optimizing the report for performance. You can also try using DirectQuery or Live Connection instead of Import to minimize the amount of data that needs to be loaded into Power BI.
Conclusion: How TrnDigital Can Help
Does this seem complicated? To integrate and work with Power BI and Excel efficiently, you can work with Power BI experts who can offer Power BI consultancy, training, and support services to help you optimize the use of Power BI for data analysis and reporting.
TrnDigital can help you with everything from getting started with Power BI to developing and implementing effective dashboards that meet your unique business requirements. With deep knowledge of Power BI and data analysis, we can help you unlock the full potential of your data to drive better business outcomes.
Reach out now to learn more.


